Executing routine marketing tasks manually, tracking down data in disparate systems, and then working to compile all that data into accurate reports takes up a lot of your marketing team’s time. How much more impact and revenue could your marketing team drive if processes were optimized, so that their time was freed up? We created this Marketing ROI Calculator to find out.
The calculator provides a visualization of how many more potential campaigns your team could launch with the time they are given back and what your potential generated revenue could be as a result.
It uses averages taken from marketing research on where marketer’s spend their time, with typical campaign conversion rates, and salaries. Based on the research and first-hand experience, we identified the below inhibitors as areas of opportunity for marketing optimization and used these findings in the Marketing ROI Calculator.
Marketing Areas of Need for Optimization
Consider the must-have tasks of marketing, attribution reporting, lead capture, qualification, and routing to sales, email and landing page creation, and the list goes on. If your team is having to export and import data from several data sources, clean up information in spreadsheets, manually manage a marketing queue of inbound leads, or create emails or landing pages from scratch, then there are several opportunities for marketing optimization.
The question is, which area is negatively affecting your team and your business the most?
#1
Collecting, Organizing & Analyzing Data
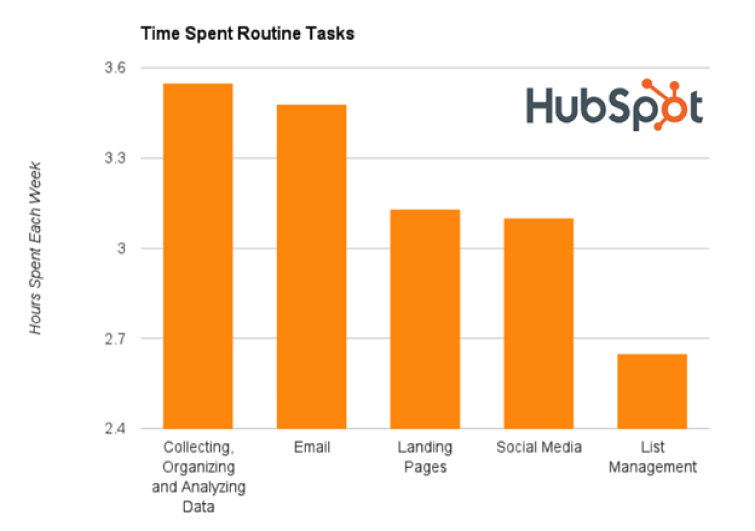
HubSpot did a survey to see how much time marketers are spending on routine tasks on a weekly basis and found that collecting, organizing, and analyzing data came in at number one. The amount of time your team spends on this can fluctuate depending on how many data sources you have and whether or not your systems are integrated.
If you have all of your marketing data flowing into one source of truth, the CRM or your marketing automation system, then the time it takes to gather data is reduced down to a minimum. However, if you have your marketing data scattered across disparate systems then the amount of time it takes to gather data could be over three hours or more of your team’s time per week.
According to Stackbeam, most mid-size companies on average use 27 martech tools. How many of those tools are capturing critical campaign data that your marketing team is having to export, clean up in a spreadsheet, and then import into your CRM or marketing automation system?
The negative effect here is not just the time that this task is taking from your team, it is the fact that marketing leaders like you, cannot get access to real-time, accurate campaign performance data to make strategic decisions.
#2
Building Campaign Structure
As your team is spending their day trying to manage and compile all the data, they also have to make sure that they have their campaign structure in place to make sure that the campaign reports will actually show the attribution data you need.
Campaign structure is the foundation of marketing attribution. If you do not have your campaigns set up properly in your CRM, you will not be able to access the data you need to make strategic decisions.
The problem is that creating campaigns manually in the CRM is tedious and often when done by multiple team members, it can lead to inconsistencies resulting in inaccurate campaign data.
Building out a campaign hierarchy manually for one campaign with multiple child campaigns underneath along with tracking links can take almost an hour. If your team needs to create multiple hierarchies in the same week, then that time could double or triple.
This is process is a must-have for accurate and reliable campaign reports, but it can take up way too much of your team’s time, which is why developed a way for it to be done in an automated fashion, so that marketers could spend less time creating campaigns and more time on strategy and launching revenue driving initiatives. Play the below video to learn more.
#3
Manual Lead Qualification & Routing
Aside from attribution reporting and managing campaign performance data, there is the lead qualification and routing aspect of marketing operations.
If you have a marketing automation platform already in your tech stack, you are most likely using your marketing forms and chatbots to qualify leads with the data that you receive from their submissions and automatically scoring their level of intent based on the campaigns they interact with. However, if you do not have an automated lead qualification process set up, this falls on a marketing team member to execute it manually, which takes up more of their time.
Then the routing comes in. If lead routing is not being done automatically, it is up to someone on the revenue team to do it manually. Maybe it is your marketing operations manager, a sales manager, your demand gen lead, or perhaps your sales operations manager. Either way it is taking up the time of someone on your team. The number of leads coming into your funnel and the size of your sales team depends on just how much time it could be taking up from your team, but an average is a little over two hours.
Similar to how tracking down data in disparate systems to create marketing reports has a negative effect on your business and not just your team’s time, the same goes for manual lead qualification and routing.
Consider your speed to lead for your hot leads, the most ideal leads for your business that are ready to talk to sales. According to the Harvard Business Review, salespeople that respond to leads in five minutes or less are 100x more likely to connect and convert them to opportunities. The Marketing ROI Calculator does not quantify the leads that you are missing out on due to slow lead follow up from manual processes, but this is an effect to keep in mind when considering the true impact that an inefficient lead flow process has on your business.
#4
Email Marketing & Landing Pages
Two other tasks that HubSpot uncovered as routine tasks that were taking up marketing’s time are list management and email creation and sending.
It is critical for marketers to be able to send the right message to the right people at the right time. However even with active or dynamic lists being used with marketing automation software lists can still quickly get out of date whether it is from job changes or automation not being set up on the CRM side to update your contact and account data in real time. If lead and contact data is not being updated on a regular basis automatically, it falls on the shoulders of your marketers that are laboring to make sure their email recipient list is accurate.
The other side of this is email creation. If your team does not have templates that are optimized for multiple email carriers and mobile rendering then they are going to often be starting from scratch or spending quite a bit of time coding.
Similar to how it takes time to build an email template from scratch, it is the same for landing pages. If your team does not already have fully optimized templates in place to start, then they are going to be spending a lot of their time creating these assets.
The beauty is that your marketing team’s time can be saved and your department can drive more impact and revenue for the business, but it requires prioritization towards optimizing your marketing processes.
To find out what this would look like for your business, you can access the Marketing ROI Calculator, enter your business’ inputs, and visualize your results.
Using the Marketing ROI Calculator
The Marketing ROI Calculator answers the hypothetical question, if my marketing team’s time was freed up from the repetitive and mundane tasks described above, how many more revenue driving campaigns would my team be able to launch? How much more potential revenue could we generate? It points to the return you could experience as a result of investing in marketing optimization.
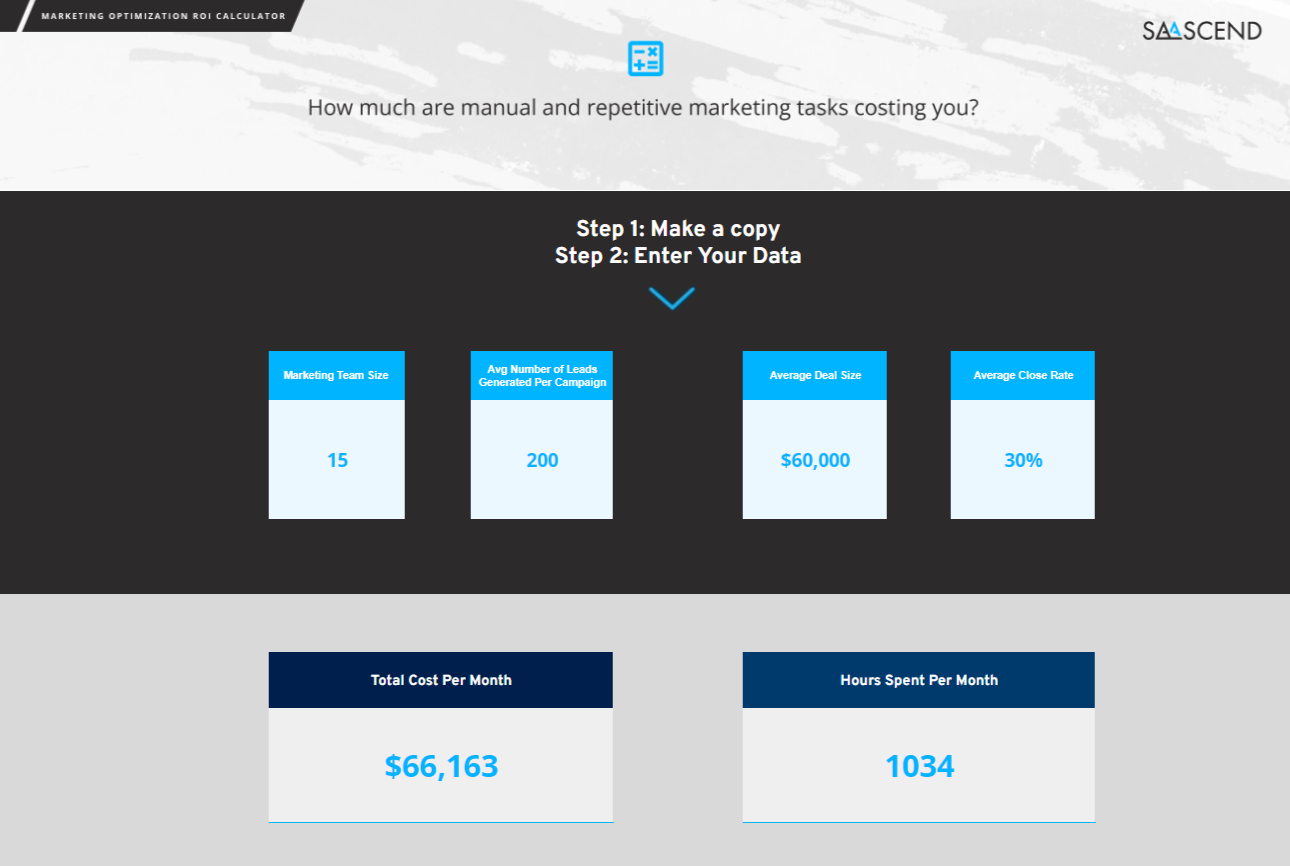
To use the calculator, first make a copy of it for yourself, then enter the below information.
-
-
- Size of your marketing team
- Average number of leads generated per campaign
- Average deal size
- Average close rate
-
The data inputs you provide to calculate your potential results when marketing processes are fully optimized.
Once you enter your data, all the below outputs dynamically update to share your results.
-
-
-
- Number of hours spent across your team per month
- Amount spent in operational costs per month
- Number of hours you could save
- Amount you could save in operational costs
- Number of potential campaigns you could launch
- Amount of potential revenue you could generate
-
-
Your Calculated Costs
The Marketing ROI Calculator takes the amount of hours that marketers typically spend on the repetitive and mundane tasks described in this article and then it multiplies that across your entire team which is where your team size comes in. The calculator then uses the average hourly rate of a marketing operations manager to multiply that by the number of hours totaled per month to provide your operational costs.
What You Could Be Saving
If you choose to invest in optimizing your marketing processes, the Marketing ROI Calculator provides what you could save if all the tasks were reduced down to take up only a third of the original time spent.
The Return on Your Investment
Your average leads generated per campaign, your average deal size, close rate, and the amount of time that you save, are all used to factor in how many potential campaigns you could launch and how much potential revenue you could drive with those campaigns.
Depending on the campaign, on average it could take a marketing team about 3 weeks to launch a campaign, meaning 120 working hours. For example, if you save 720 hours across your entire marketing team for a whole month, you could be launching 6 more campaigns. The Marketing ROI Calculator then factors in the amount of leads that you typically generate per campaign.
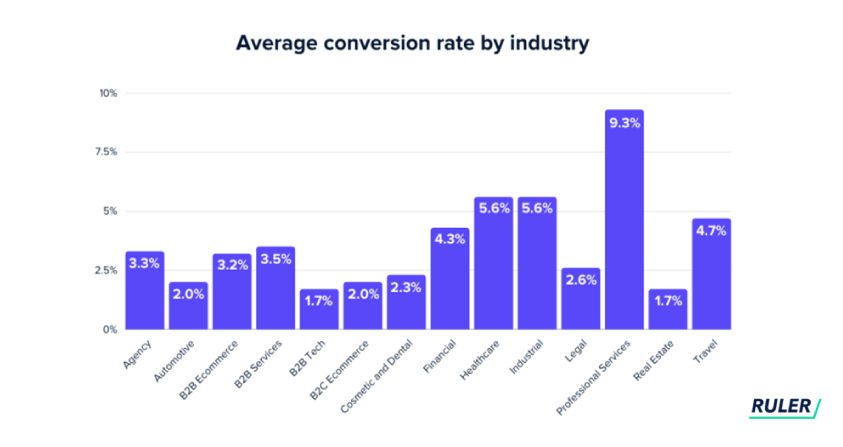
According to Ruler Analytics, on average the conversion rate from generated lead to Sales Qualified Lead or Pipeline is about 1.7% across the B2B Tech industry. If your webinars typically generate 200 leads, then this conversion rate assumes that about 3 leads will turn into deals in the pipeline.
Your average deal size and close rate then determines the amount of potential revenue that campaign could generate. Taking the example of having the time to launch six more campaigns a month with the below inputs, generating 200 leads each, the potential revenue generated would be $360,000.
| Average Deal Size | $60,000 |
| Close Rate | 30% |
200 leads generated per campaign x 6 = 1200 leads generated total
1.7% conversion rate to pipeline
1200 leads x 0.017 = about 20 leads converted to opportunities
30% close rate
20 opportunities x 0.3 = 6 opportunities likely to close
6 x $60,000 = $360,000
Your leads generated per campaign may change depending on the campaign, along with your average conversion rate from generated lead to pipeline, but the Marketing ROI Calculator allows you to gauge a general idea of the potential revenue your team could generate as a result of having your marketing processes optimized.
This calculator is purposed to provide you with a resource to conceptualize the world of possible and if need be, help to justify the investment into marketing optimization to the rest of the C-Suite. When you access it, you create a copy to have it as your own and can play around with the numbers to visualize the results of different scenarios.
Your team’s time is too precious to have it be spent on manual and mundane tasks that could be otherwise dedicated towards developing your marketing strategy, thinking creatively, and launching more revenue driving campaigns. Consider what optimization could look like for your marketing engine and then act to start empowering your team to reach their revenue potential.

Now we feel our data is reliable and that we can accurately measure our ROI.
Emily Wilkinson, Sr. Finance & Administration


