
Do you know the average length of time it takes for a prospect to progress through your funnel and become a customer? Do you know what the rate of conversion is from Prospect to Marketing Qualified Lead, to Sales Accepted Lead, and finally all the way to Customer? In order to forecast the amount of leads that marketing needs to generate at the top of the funnel, and successfully predict the amount of Sales Accepted Leads that will become closed won deals, teams need to use lifecycle stage tracking to achieve funnel predictability.
In our eBook, The Power of Lifecycle Stages: The Keys to Accelerating Your Funnel, we describe how to go about tracking your funnel and the mechanisms that need to be in place in order to capture the data necessary to gain funnel visibility.
❶ Your lifecycle stages need to be defined and implemented into your CRM system and ideally, your marketing automation platform.
❷ You should have fields and time stamping set up to track the progression of leads through your funnel and the time span between each stage.
❸ Automation should be configured to trigger automatic lifecycle stage field updates based on the actions that prospect’s and go-to-market teams take.
Once you have all of the above, then comes the metrics that you are tracking for and understanding how this leads into achieving predictability of your funnel.
Lifecycle Stage Tracking
To understand the progression of your funnel, the main two metrics to track are conversion rates and velocity. Conversion rates inform your team of the number of people that will come out at the bottom of your funnel, out of the number entering at the top. Velocity provides the length of time a lead takes to travel through the funnel.
Conversion Rates
To understand the success of your conversion rates throughout your funnel, you need to first capture a baseline of data, meaning that once you have the mechanisms for tracking in place, you will most likely need to go through a couple of sales cycles to understand what your average conversion rate is between each stage.
Conversion Rate Formulas:
# of MQL’s / # of Prospects x 100
# of SAL’s / # of MQL’s x 100
# of SQL’s / # of SAL’s x 100
# of Customers / # of SAL’s x 100
# of Customers / # of Prospects x 100
Then once you have your baseline, it can be beneficial to consider what the benchmark conversion rates are for your industry. For example, Founder & CEO, Craig Jordan, shared on a fireside chat that a good lead acceptance rate from sales for marketing teams to aim for is 75%. Meaning that if you have a conversion rate of 75% from MQL to SAL, you have great team alignment and successful processes in place for lead qualification.
Tracking the conversion rate between each stage in the funnel will help to pinpoint where special attention is needed for process improvements. The goal is to improve the overall funnel conversion rate from Prospect to Customer and taking a closer look at the progression between each stage will help to achieve this.

Velocity
Measuring the delta in time between each lifecycle stage will inform your team of the speed at which leads are progressing through the funnel. Understanding what success looks like here really depends on your business model. According to HubSpot, the average sales cycle for a SaaS company is 84 days, but the Annual Contract Value (ACV) can shorten or lengthen this. In their guide, they explain that if the ACV is less than $5k then the sales cycle will be around 40 days. If the ACV is more towards the $100k range, then the sales cycle can be around 170 days.
As mentioned before, track your overall funnel velocity and establish your baseline data. Compare this with your ACV to gauge where you are falling in terms of success. There is always room for improvement, but having this initial understanding will show your team if there is a lot of work that needs to be done or just slight optimizations that can be made for incremental gains.
Once you have baseline data in place for your funnel velocity, you can identify when stages are being stalled, and work with your operations teams to see if there is a malfunctioning point in the system, or explore an automation that could be done to streamline the process for your go-to-market teams.
Achieving Funnel Predictability
Tracking your funnel conversion rates and velocity empower leadership with the insights needed for accurate forecasting. For example, if a team has the baseline conversion rates referenced in Figure 1, then they have an idea of the amount of new business they will win if marketing generates 1,000 leads.
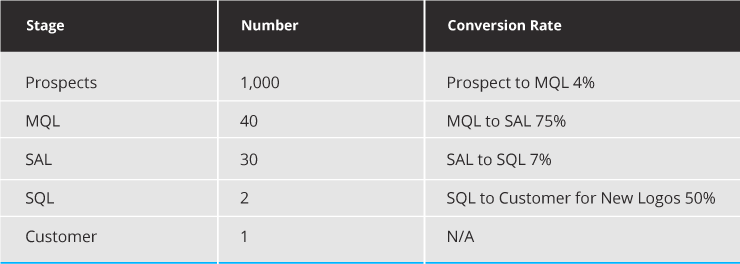
Figure 1, Based on the conversion rate between each stage in the funnel, there will be about one customer expected to come out of 1,000 generated leads.
The second layer to this is the velocity. How long is it taking for one customer to come out of the 1,000 leads that marketing generated? 3 months, 6 months, or 12 months?
Campaign Tracking & Lifecycle Stages
Marketing can combine the sophistication of the lifecycle stage tracking with their marketing campaigns to gain even further insight as to how fast leads will progress through the funnel. If they have the proper campaign tracking in place, teams can pinpoint the types of campaigns that are progressing leads through the funnel the fastest.
-
- How long does it take a prospect to become a customer that entered the funnel through our community?
- Which types of campaigns are accelerating prospects through the funnel to progress them to the next stage?
- Are there any campaign touch patterns that exhibit a faster velocity?
These are the types of questions that can be answered when teams take funnel tracking on a deeper level and combine it with their campaign data.
Marketing & Sales Forecasting
If the company goal is to gain 100 new logos for the year, and sales and marketing know their conversion rates between each stage, then they can forecast to understand the numbers that need to be generated for each stage for the year (fig 2).
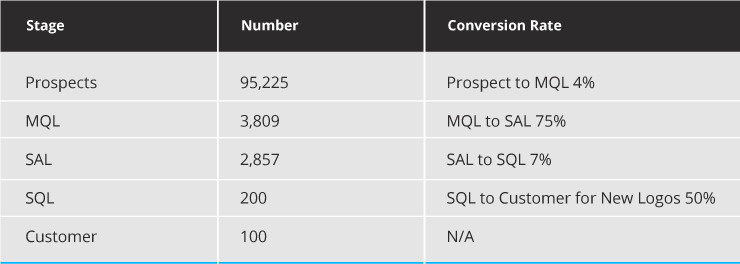
Figure 2, Based on the end goal of 100 new logos, the conversion rates in this table were used to then provide an estimation of the numbers that sales and marketing would need to hit for the year for each lifecycle stage.
The velocity and the baseline conversion success rates per quarter will then help to determine the goals that marketing and sales need to achieve on a monthly and quarterly basis.
As leadership tracks the progress of their teams, it gets easier for them to know when they are on track or not on track for their quarterly goal because they finally have predictability of their funnel.
Managing Your Lifecycle Stages for Revenue Growth

